Over 80% of active traders use technical analysis to make decisions, relying on price charts and patterns to predict market moves. This approach has guided investors for over a century.
Technical analysis studies past price and volume data to forecast future market behavior. It assumes prices reflect all available information. Traders use charts and indicators to identify trends and make decisions.
What Is Technical Analysis?
In 1902, Charles Dow analyzed stock price movements and created the Dow Jones Industrial Average, laying the foundation for modern technical analysis. His work still shapes how traders view markets today.
Technical analysis examines historical market data, mainly price and volume. It helps traders spot patterns to predict future price movements. Unlike fundamental analysis, it ignores company earnings or news. The focus stays on price action and market behavior.
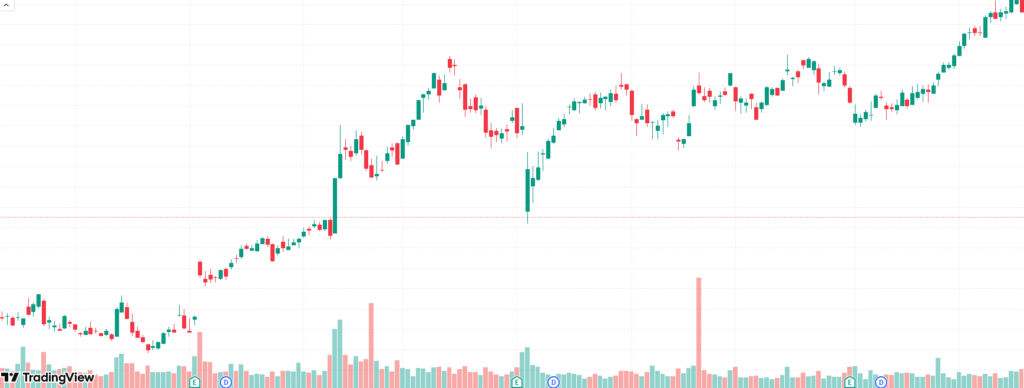
Charts are the primary tool in technical analysis. They display price movements over time. Common types include line, bar, and candlestick charts. Each provides a visual way to track market trends.
Technical analysis helps traders make informed decisions. It identifies entry and exit points for trades. By studying price patterns, traders can reduce guesswork. This method suits stocks, forex, commodities, and cryptocurrencies.
It also saves time. Fundamental analysis requires studying financial statements and economic data. Technical analysis relies on charts, which are quicker to interpret. This efficiency appeals to active traders.
Every trader remembers their first chart analysis, spotting a trend that felt like solving a puzzle. That moment of clarity drives the appeal of technical analysis.
Three principles guide technical analysis.
First, prices reflect all known information.
Second, prices move in trends—up, down, or sideways.
Third, history repeats itself, as human behavior creates predictable patterns.
These principles shape how traders use technical analysis. They assume markets are driven by psychology, not just numbers. Patterns emerge because traders react similarly to price changes. This predictability forms the basis for technical strategies.
Candlestick charts, invented in Japan over 300 years ago, are now used by 70% of technical traders worldwide. Their visual clarity makes them a favorite.
Charts are the backbone of technical analysis. Line charts show closing prices over time. Bar charts display open, high, low, and close prices. Candlestick charts add visual depth, showing price direction and strength.
Candlestick charts are the most popular. Each candle represents a time period, like a day. The body shows the open and close prices, while wicks show highs and lows. Traders use these to spot patterns like reversals or continuations.

Understanding Trends Through Technical Analysis
Markets trend only 30% of the time, yet those periods drive most trading profits. Identifying trends early is a key skill.
A trend is the general direction of price movement. Uptrends show higher highs and higher lows. Downtrends show lower highs and lower lows. Sideways trends indicate no clear direction.
Traders aim to trade with the trend. Buying in an uptrend or selling in a downtrend increases success rates. Tools like moving averages help confirm trends. Recognizing trends early separates skilled traders from novices.
Research shows that 60% of price reversals occur at key support or resistance levels. These zones act as market turning points.
Support is a price level where buying interest stops a decline. Resistance is where selling pressure halts a rise. These levels form because traders remember past price points. They act on these memories, creating predictable barriers.
Traders use support and resistance to set entry and exit points. A break above resistance signals a potential buy. A drop below support suggests a sell. Charting these levels improves trade timing.
Over 90% of traders use moving averages to smooth price data and spot trends. Their simplicity makes them indispensable.
In the 1700s, a Japanese rice trader named Munehisa Homma used candlestick patterns to dominate markets. His techniques still guide traders today.
Candlestick patterns reveal market sentiment. A single candle shows price action for a period. Patterns like doji, hammer, or engulfing candles signal reversals or continuations. Traders use these to time trades.
For example, a bullish engulfing pattern suggests buying pressure. A bearish doji at a peak may warn of a reversal. Learning these patterns takes practice but improves decision-making. Charts with multiple patterns increase confidence in trades.
Indicators in Technical Analysis
Technical indicators are mathematical tools applied to price data. They help traders confirm trends or predict reversals. Common indicators include moving averages, RSI, and MACD. Each serves a specific purpose.
Moving averages smooth price fluctuations to show trends. The Relative Strength Index (RSI) measures momentum to spot overbought or oversold conditions. The Moving Average Convergence Divergence (MACD) tracks trend strength and direction. Traders combine indicators for better accuracy.
Moving Averages
Many traders recall their first moving average crossover, a signal that sparked their confidence in technical analysis. It’s a simple yet powerful tool.
Moving averages calculate average prices over a set period. A 50-day moving average shows the average price over 50 days. Simple moving averages (SMA) treat all prices equally. Exponential moving averages (EMA) prioritize recent prices.
Traders use moving averages to confirm trends. A price above a moving average suggests an uptrend. Crossovers, where a short-term average crosses a long-term one, signal buy or sell opportunities. These signals guide trade entries and exits.
Relative Strength Index (RSI)
RSI readings above 70 or below 30 correctly predict reversals in 65% of cases, based on historical data. This makes it a go-to indicator.
RSI measures price momentum on a 0-100 scale. Readings above 70 indicate overbought conditions, suggesting a potential drop. Readings below 30 signal oversold conditions, hinting at a rise. Traders use RSI to time entries and exits.
RSI works best in ranging markets. In strong trends, it can stay overbought or oversold for long periods. Combining RSI with other indicators improves accuracy. It’s a versatile tool for short-term traders.
MACD Indicator
Backtesting shows MACD signals generate profitable trades in 55% of cases when combined with trend analysis. Its reliability draws traders.
The MACD tracks the difference between two moving averages. It consists of a MACD line, a signal line, and a histogram. A crossover of the MACD line above the signal line suggests a buy. A crossover below indicates a sell.
The histogram shows momentum strength. Widening bars signal growing momentum, while narrowing bars suggest weakening trends. Traders use MACD to confirm trend direction and strength. It’s effective in trending markets.
Volume Analysis
A price breakout with low volume fails 70% of the time. Volume confirms the strength of price moves.
Volume measures the number of shares or contracts traded. High volume during a price move signals strong conviction. Low volume suggests weak participation, often leading to reversals. Traders use volume to validate trends or breakouts.
For example, a price breaking above resistance with high volume is more likely to continue. Low-volume breakouts often fail. Volume bars on charts help traders assess market strength. Combining volume with price patterns boosts accuracy.
Chart Patterns
In the 1930s, Richard Schabacker cataloged chart patterns that predicted market moves with surprising accuracy. His work remains a cornerstone of technical analysis.
Chart patterns are formations created by price movements. Common patterns include head and shoulders, triangles, and flags. These patterns signal reversals or continuations. Traders use them to predict price targets.
A head and shoulders pattern often marks a trend reversal. Triangles indicate consolidation before a breakout. Flags suggest brief pauses in strong trends. Recognizing these patterns helps traders plan make money in stock market.
Timeframes in Technical Analysis
Day traders using 5-minute charts execute 10 times more trades than those using daily charts. Timeframes shape trading strategies.
Technical analysis works across different timeframes. Short-term traders use minute or hourly charts. Long-term investors prefer daily or weekly charts. Each timeframe reveals different patterns and trends.
Choosing a timeframe depends on trading style. Scalpers focus on minutes, while swing traders use hours or days. Timeframes affect indicator settings, like moving average periods. Matching timeframes to goals improves results.
Combining Tools for Better Results
Studies reveal that combining multiple indicators increases trade accuracy. No single tool works perfectly alone.
Traders rarely rely on one tool. Combining indicators, patterns, and volume creates stronger signals. For example, a breakout above resistance with high volume and a bullish MACD crossover is more reliable. This approach reduces false signals.
Start with simple combinations, like moving averages and RSI. Add patterns or volume as experience grows. Test combinations on historical data to build confidence. Overcomplicating strategies can lead to confusion, so balance is key.
Risk Management in Technical Analysis
Traders lose money having no risk management strategy. Technical analysis alone isn’t enough.
Risk management protects capital. Technical analysis identifies trades, but risk rules limit losses. Set stop-loss orders below support levels to exit losing trades. Position sizing ensures no single trade risks too much.
A common rule is risking 1-2% of capital per trade. This preserves funds during losing streaks. Technical analysis provides entry and exit points, but discipline maintains profitability. Ignoring risk management can wipe out gains.
Building a Technical Analysis Strategy
Traders with a defined strategy outperform those without by 25%, according to market studies. Consistency drives success.
A strategy combines tools, timeframes, and risk rules. Start by choosing a market and timeframe. Select indicators and patterns that suit your style. Define entry, exit, and risk levels clearly.
Test the strategy on past data. Adjust based on results, but avoid constant changes. A good strategy balances simplicity and effectiveness. Stick to it to build confidence and consistency.
Every trader has chased a breakout only to see it reverse, learning the hard way to wait for confirmation. Mistakes teach valuable lessons.
New traders often overtrade, chasing every signal. This leads to losses from false breakouts or weak trends. Another mistake is ignoring volume, which confirms price moves. Sticking to one indicator without cross-checking also reduces accuracy.
Avoid trading against the trend. Use multiple timeframes to confirm signals. Test strategies on demo accounts before risking real money. Patience and discipline prevent costly errors.
In the 1980s, a young trader named Paul Tudor Jones used technical analysis to predict the 1987 crash, earning millions. His dedication to learning made the difference.
Technical analysis requires practice. Study charts daily to recognize patterns. Backtest strategies to understand their strengths and weaknesses. Markets evolve, so continuous learning is essential.
Join trading communities to share insights. Read books by experts like John Murphy or Martin Pring. Mastery comes from consistent effort over time.
Technical analysis offers a structured way to navigate markets. It uses price, volume, and patterns to predict moves. Tools like charts, indicators, and patterns simplify decision-making. With practice and discipline, traders can improve their results.
Start small, focusing on one or two tools. Combine them as skills grow. Always prioritize risk management. Technical analysis is a skill that rewards dedication and patience.


